Warning
You are currently viewing v"2.11" of the documentation and it is not the latest. For the most recent documentation, kindly click here.
Integrate with Prometheus Click here for latest
Overview of all Prometheus metrics that KEDA provides
The KEDA Operator exposes Prometheus metrics which can be scraped on port 8080 at /metrics. The following metrics are being gathered:
keda_build_info - Info metric, with static information about KEDA build like: version, git commit and Golang runtime info.keda_scaler_active - This metric marks whether the particular scaler is active (value == 1) or in-active (value == 0).keda_scaler_metrics_value - The current value for each scaler’s metric that would be used by the HPA in computing the target average.keda_scaler_metrics_latency - The latency of retrieving current metric from each scaler.keda_scaler_errors - The number of errors that have occurred for each scaler.keda_scaler_errors_total - The total number of errors encountered for all scalers.keda_scaled_object_errors - The number of errors that have occurred for each ScaledObject.keda_resource_totals - Total number of KEDA custom resources per namespace for each custom resource type (CRD).keda_trigger_totals - Total number of triggers per trigger type.keda_internal_scale_loop_latency - Total deviation (in miliseconds) between the expected execution time and the actual execution time for the scaling loop. This latency could be produced due to accumulated scalers latencies or high load. This is an internal metric.Operator SDK framework as explained here.The KEDA Webhooks expose Prometheus metrics which can be scraped on port 8080 at /metrics. The following metrics are being gathered:
keda_webhook_scaled_object_validation_total- The current value for scaled object validations.keda_webhook_scaled_object_validation_errors - The number of validation errors.The KEDA Metrics Adapter exposes Prometheus metrics which can be scraped on port 8080 at /metrics. The following metrics are being gathered:
Operator SDK framework as explained here.A premade Grafana dashboard is available to visualize metrics exposed by the KEDA Metrics Adapter.
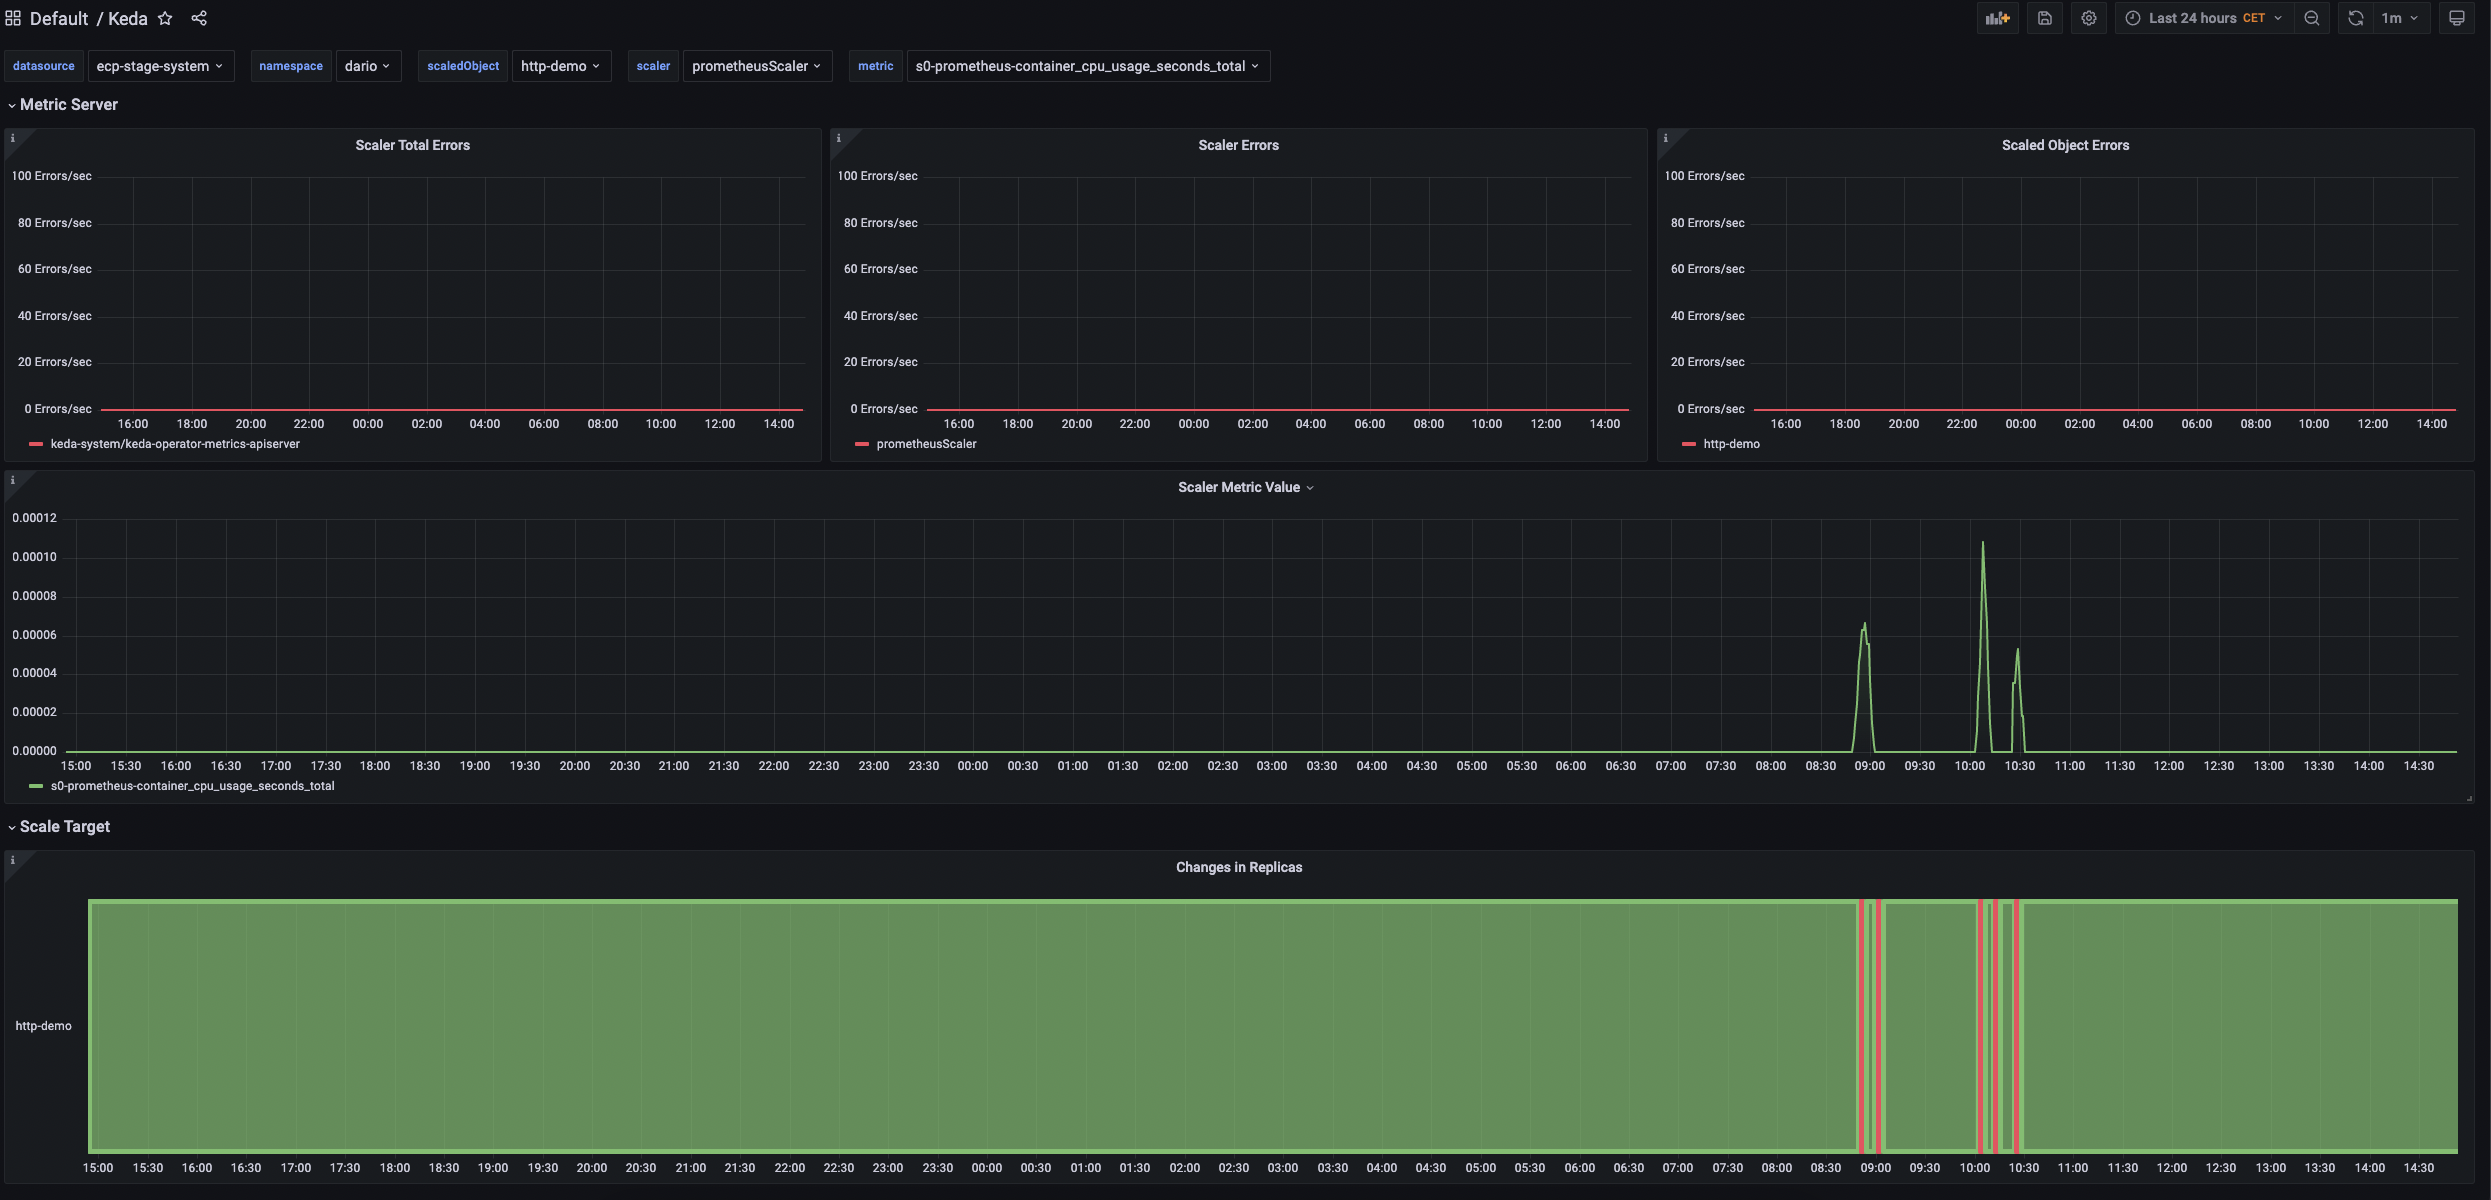
The dashboard has two sections:
On top, the dashboard supports the following variables: