Announcing KEDA v2.9 🎉
Jeff Hollan (Snowflake), Tom Kerkhove (Microsoft) and Zbynek Roubalik (Red Hat)
December 12, 2022
We recently completed our most recent release: 2.9.0 🎉!
Here are some highlights:
- Newly published Deprecations and Breaking Change policy (docs)
- Introduce new CouchDB, Etcd & Loki scalers
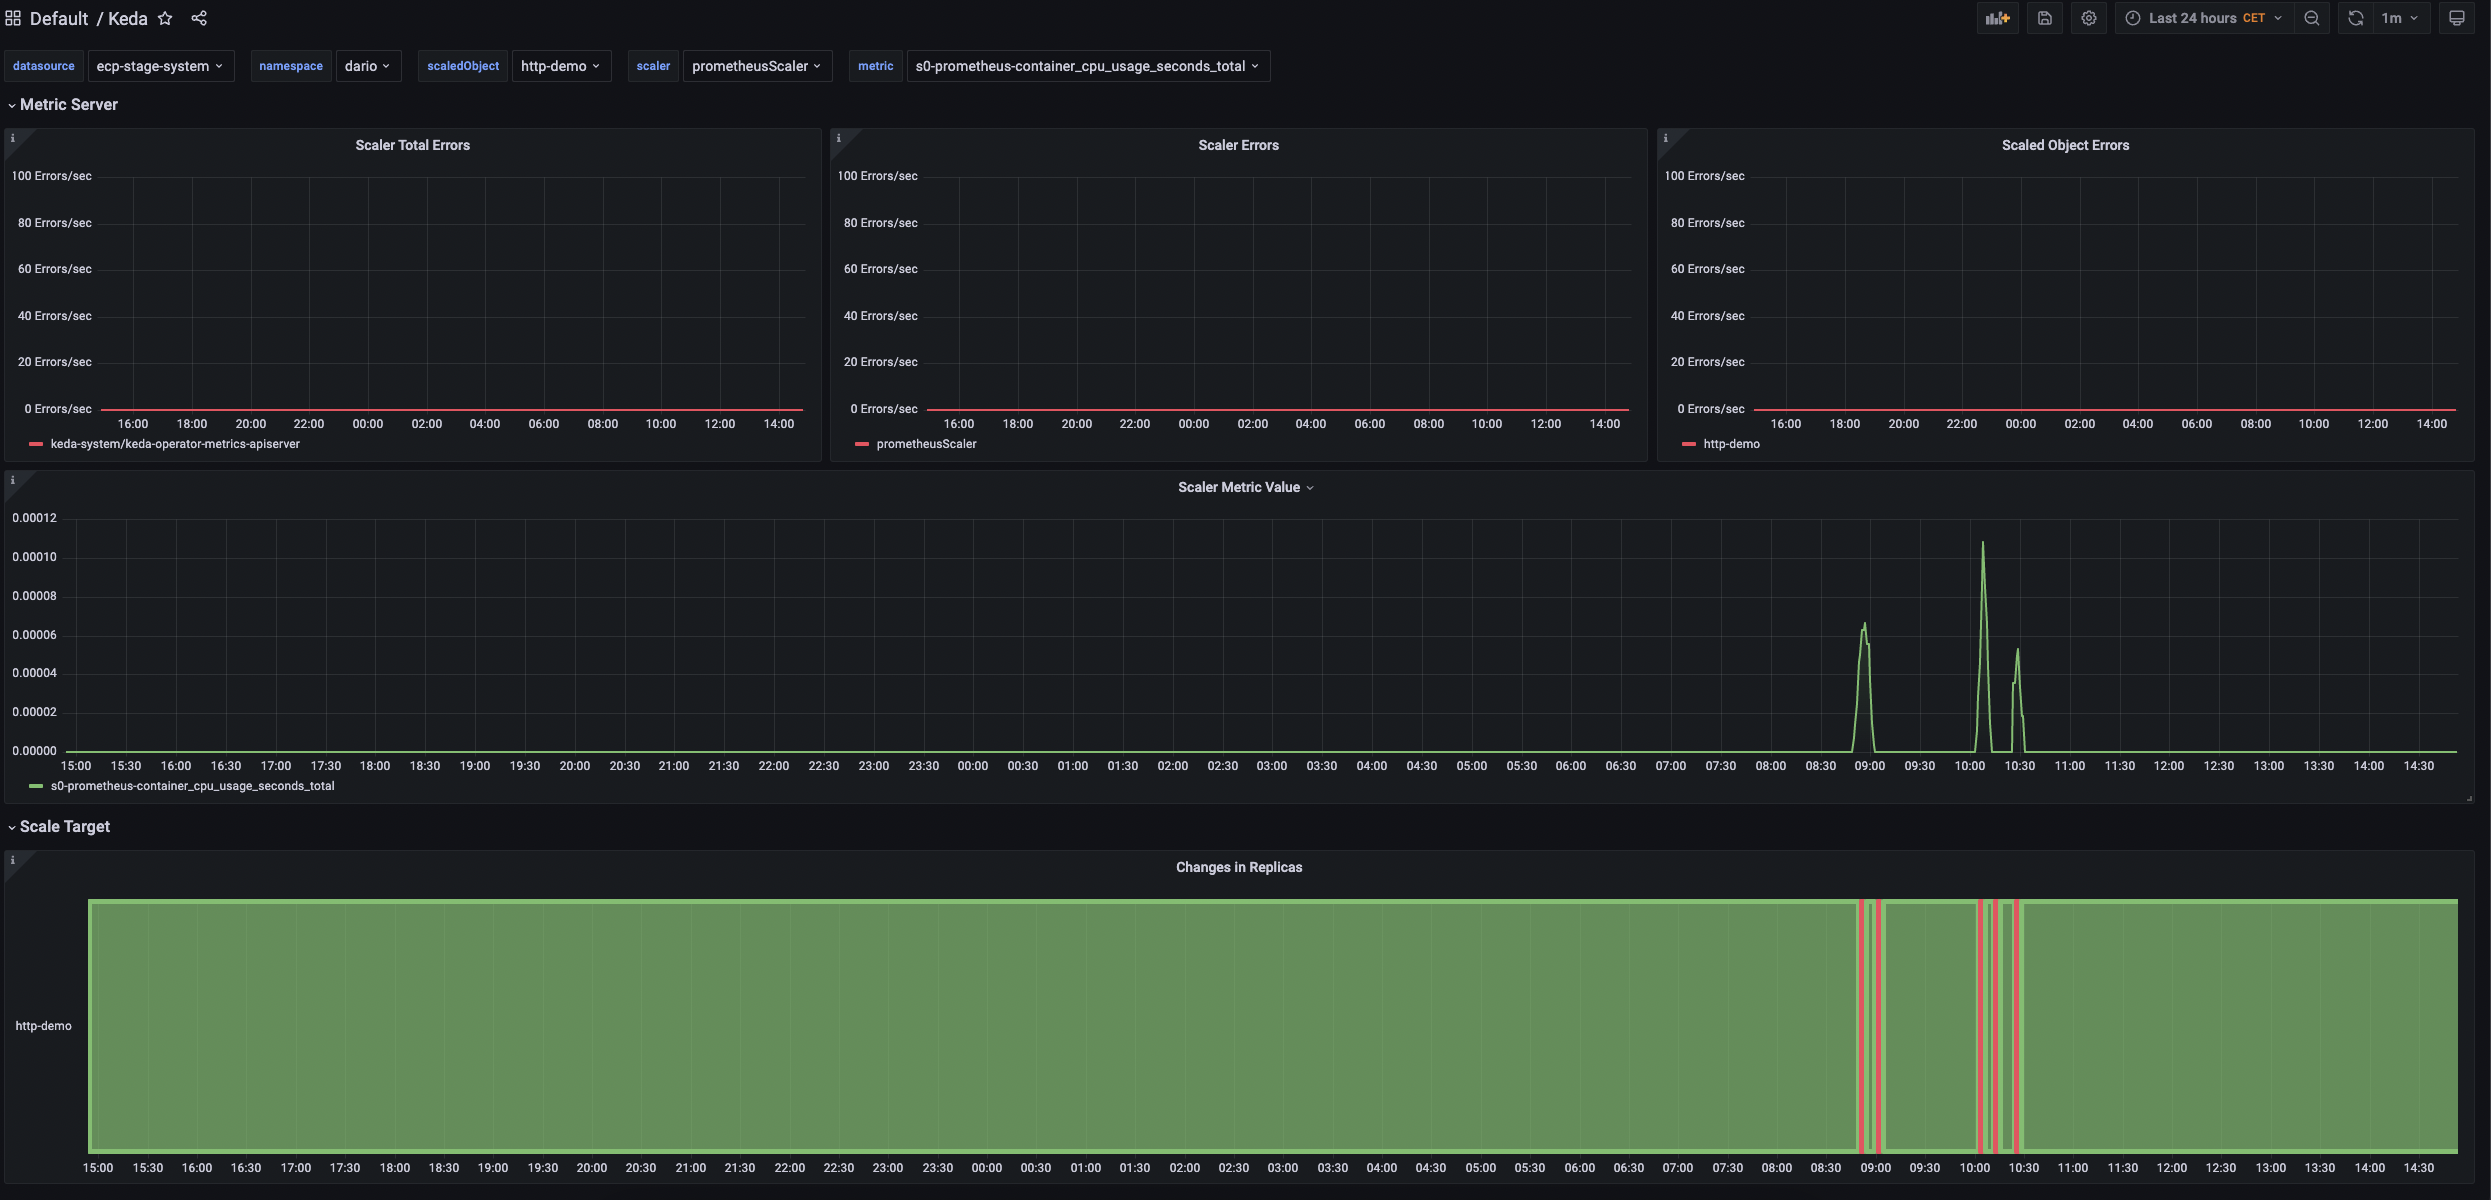
- Introduce off-the-shelf Grafana dashboard for application autoscaling
- Introduce improved operational metrics in Prometheus
- Introduce capability to cache metric values for a scaler during the polling interval (experimental feature)
- Performance improvements and architecture changes on how metrics are exposed to Kubernetes
- Azure Key Vault authentication provider now supports pod identities for authentication
- A ton of new features and fixes for some of our 50+ scalers
Potential breaking changes and deprecations include:
- As per our support policy, Kubernetes v1.23 or above is required and support for Kubernetes v1.22 or below was removed (docs)
- Upgrading the API version of managed HPA objects from
autoscaling/v2beta2toautoscaling/v2 - Prometheus metrics on KEDA Metric Server are deprecated in favor of Prometheus metrics on KEDA Operator (#3972 | Discussion)
You can keep an eye and join the discussion for future breaking changes and deprecations in our GitHub issues.
New & Improved Scalers
KEDA now has 50+ built-in scalers, giving you instant access to provide event driven scale across a variety of sources.
New scalers in this release are:
In addition to new scalers, various new features and improvements were added to Kafka, Azure Event Hubs, Azure Pipelines, GCP Storage, Metrics, NATS Jetstream, Prometheus, Pulsar, Azure Blob, GCP Stackdriver, and New Relic scalers.
Here are a few improvement highlights:
- AWS Scalers: Introduce new AWS endpoint URL settings
- Apache Kafka Scaler: Support for SASL/OAuth bearer authentication and/orlimiting Kafka partitions KEDA will monitor
- Azure Event Hubs Scaler: Support Azure Active Directory Pod & Workload Identity authentication for Storage Blobs, Dapr checkpointing and using connection strings for Event Hub namespace instead of the Event Hub itself.
- Azure Service Bus Scaler: Support for Shared Access Signature (SAS) tokens for authentication and use of regex in
queueName/subscriptionName - ElasticSearch Scaler: Support for Elastic Cloud
- GCP Storage Scaler: Support for blob prefix & delimiters
- Metrics API Scaler: Support for unsafeSsl parameter to skip certificate validation when connecting over HTTPS
- NATS Jetstream Scaler: Support for clustered scenarios
- NATS Scalers: Support HTTPS protocol
- Prometheus Scaler: Introduce skipping of certificate check for unsigned certs
- Pulsar Scaler: Add support for basic and bearer token authentication along with support for partitioned topics
Details on the underlying fixes can be found in the changelog.
Production-grade operating experience for autoscaling applications
There are a number of improvements into the ways KEDA provides operational information in Prometheus and how you can consume it.
For starters, our operator now exposes Prometheus metrics which can be scraped on port 8080 at /metrics. It provides the same set of metrics as the metric server (although renamed) offers today, in addition to a few new metrics and the introduction of a ScalerName label.
The metrics are moving given we are changing how KEDA is integrating with external systems so that we can improve the performance and reduce the load on those external systems.
As part of this, we are deprecating the KEDA-specific metrics in our metric server and recommend end-users to use the metrics in the operator. Join our conversation there.
Next, we have introduced keda_resource_totals and keda_trigger_totals as metrics that provide insights into your autoscaling landscape and the various autoscaling triggers that are being used.
Metrics are great - But they have to be consumed. That’s why we introduced a new Grafana dashboard allows end-users to easily visualize the KEDA metrics in Grafana to see how your applications are scaling:
Lastly, end-users using ScaledJobs can now see what the minimum replica count is when inspecting resources through the Kubernetes API.
Learn more about our available Prometheus metrics and our Grafana dashboard in our docs.
Change in the architecture and metrics caching
In this release we focused on performance improvements. Let’s talk about these changes: KEDA has two main components - the Operator and the Metrics Server. The Operator monitors ScaledObjects and ScaledJobs resources, and checks activity on the external service. The Metrics Server handles requests and queries about metric values used for scaling from Kubernetes’ Horizontal Pod Autoscaler (HPA) by checking the external service.
In previous versions of KEDA, each component needed to handle its own connection to the external service. In version 2.9, we have changed this and moved the connection logic to the Operator component. We are now using gRPC for the connection between the Metrics Server and Operator. This has several benefits, including reduced load on the external service, as there is only one connection from the Operator.
We have also introduced an experimental feature called metrics value caching. This caches the values in the Operator and can be reused in future. It can even further reduce the load on the external service. By default, Kubernetes’ HPA asks for a metric value every few seconds (as defined b --horizontal-pod-autoscaler-sync-period flag set by Kuberentes admins, which is usually set to 15 seconds). This can create unnecessary load on the external service. Caching metric values per trigger in a ScaledObject can help to overcome this problem. This is an optional feature, and can be enabled by setting the useCachedMetrics flag, then metric values are cached during polling interval as defined by pollingInterval flag and request comming from HPA to KEDA Metrics Server are served from this cache.
We are excited about the potential uses for this feature in the future, including using AI and machine learning models to affect metric values. Stay tuned for more updates and improvements in future releases of KEDA.
New ways to authenticate
In this release we have added some additional configuration options for triggers:
Azure Key Vault authentication provider now allows end-users to use pod identities for authentication for improved simplicity & security:
azureKeyVault:                                          # Optional.
  vaultUri: https://keda.vault.azure.net
+ podIdentity:
+   provider: azure-workload
    # Optionally, you can specify a user-assigned identity: identityId: <identity-id>
  secrets:                                              # Required.
  - parameter: connection
    name: ServiceBus-ConnectionString
Our Azure AD Pod Identity authentication now also has improved logs around integration with aad-pod-identity for simplified troubleshooting.
And more…
This is just some of the highlights for the latest release. You can find the full release notes here.
The next KEDA release is scheduled for March 2023.
Thanks to everyone for helping make KEDA better!
Recent posts
Google Cloud deprecationsKEDA is graduating to CNCF Graduated project 🎉
Securing autoscaling with the newly improved certificate management in KEDA 2.10
Help shape the future of KEDA with our survey 📝
Announcing KEDA v2.9 🎉
HTTP add-on is looking for contributors by end of November
Announcing KEDA v2.8 🎉
How Zapier uses KEDA
Introducing PredictKube - an AI-based predictive autoscaler for KEDA made by Dysnix
How CAST AI uses KEDA for Kubernetes autoscaling
Announcing KEDA HTTP Add-on v0.1.0
Autoscaling Azure Pipelines agents with KEDA
Why Alibaba Cloud uses KEDA for application autoscaling
Migrating our container images to GitHub Container Registry
Announcing KEDA 2.0 - Taking app autoscaling to the next level
Give KEDA 2.0 (Beta) a test drive
Kubernetes Event-driven Autoscaling (KEDA) is now an official CNCF Sandbox project 🎉